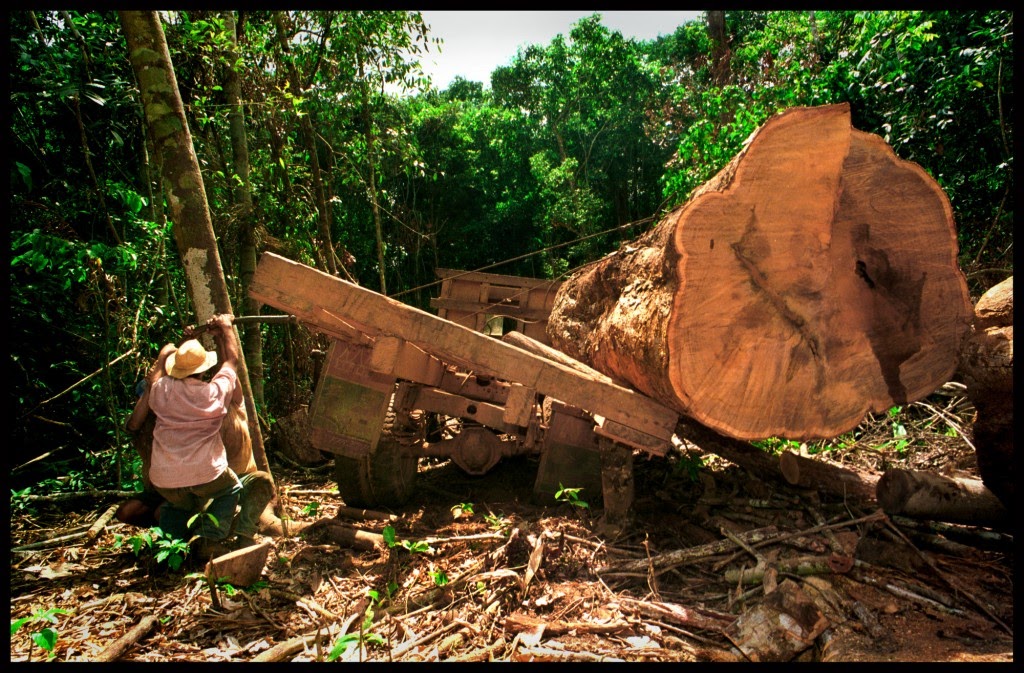
Following Burgess et al., 2014, Alesina et al., 2014 and Lubowski et al., 2014, we used the new high-resolution data Hansen et al. (2013) that identifies 1 arc second (about 30m at the equator) cells as forested or cleared for every year from 2001 to 2012. It also provide, for this 1 arc-second grid, with an estimate of the forest land cover in 2000 (coded as the percentage of the pixel size with vegetation is taller than 5meters in height), allowing to compute the deforestation rates and cover for each year. We first averaged the 2000 forest cover of every pixel of 1 arc-second on every country area. Contrarily to Lubowski et al. (2014), it is thus not a count model but a finer estimation averaging the cover of every 1 arc-second / 30 meters at the equator pixels. Given the way the data was computed from satellite imagery (Landsat 7 ETM+), we consider (1 arc-second) grid cells with more than 25% of forest cover as forests, weight the average of pixel deforested by their relative forest cover for each 30 arc-second resolution grid. Then we averaged the forest land cover on a reduced resolution grid of 30 arc-seconds (about 900m at the equator) in order to meet computing time constraints. Using this new resolution grid of 30 arc-second, we multiply the forest cover and deforestation ratios by the surface of each cell and sum every cells that have their barycenters inside a given country border, for a given year.
Hansen, Potapov et al., 2013, global forest change data country level treatment with matlab, (and thus scilab: open source equivalent software).
What does the following code do ?
Here you can find the code for running it (change the file path to your accordance) on any machine (it was run on a windows 7, 8Go RAM, i5 processor, which took about one week). See directly the final result data matlab (.mat) file (in the 'Orginal Data' header/section of this page) to avoid running it.
Matlab run
latitudes an longitudes
lat lon file 1
latitudes an longitudes 2 (NSEO)
lat lon file 2
Deforestation pixel names:
Def Pix names file
Forest cover 2000 pixel names:
For stock Pix names file
any bug or error may be reported to: leblois'at'centre-cired'dot'fr
in order to be ran on open source scilab program, comment marks '%' should be replaced by '\\'.
Here is a link to many codes in 'R' for using this dataset:
http://rpackages.ianhowson.com/cran/gfcanalysis/
Original data source:
http://commondatastorage.googleapis.com/earthenginepartners-hansen/GFC2014/
...
example of one filename: /Hansen_GFC2014_treecover2000_40N_080W.tif
A linux script to charge them quickly:
link to bash
Country political borders (2005): to be loaded
All in one (already ran, result matlab file):
Synthetic data in '.ods' (open office) and '.dta' (Stata):
ods
Our paper: What drives deforestation? Evidence from developping
countries over 2001-2010, Antoine Leblois, Olivier Damette and Julien Wofersberger (2017). Link to the pre-print.
Some (sat. observations, meteo, economics and biophysical) Data, and sometimes codes to treat raw files
- Meteo: two global equivalent gridded (and thus interpolated) datasets, resolution: half decimal degree
CRU TS2.1
University of delaware precipitation data (include estimated standard errors, providing a reliable confidence interval)
- Global protected areas (protected planet): data
and three papers looking at their effective role on forest protection:
Joppa and Pfaff, 2015
Blankspoor, Dasgupta and Wheeler, 2014
Maher and Song
- Forest (GFC february 2014, Potapov et al.) and Matlab codes (coming soon)
Data
and nice maps to visualize it through time:
Univ. of Maryland
Global forest watch (WRI)
Raw satelite imagery
- Ndvi reflectance data at a 8km resolution at the equator.
- EU JRC fAPAR data
- Night lights data, used for estimating energy infrastructures or as a proxy for economics development and a related guide for arcGIS.


